Pinned
Disclaimer and Transparency Note
Welcome to our daily stock ideas group! Here, you’ll receive trade ideas for educational purposes. Please note: This is not financial or investment advice. All trades are inherently risky, and past performance is not indicative of future results. Always do your own due diligence.
0
0
Pinned
Terms of Service (ToS)
By joining this group, you agree that the content is educational, and we make no promises or guarantees of profitability. You are solely responsible for all of your own trading decisions and their outcomes. We do not guarantee results or profits.
0
0
Pinned
bluebird bio (NASDAQ: BLUE)
This is not investment advice; it’s a trade idea for educational purposes. All trades are inherently risky and may result in a loss. Please do your own research. -------------------------------- bluebird bio (BLUE) bluebird bio is a biotechnology company that focuses on developing gene therapies for severe genetic diseases and cancer. Their core mission is to deliver transformative gene therapies to patients with few or no treatment options. Their lead product candidates target conditions such as cerebral adrenoleukodystrophy (CALD), sickle cell disease, and beta-thalassemia. BLUE has been a subject of significant attention due to its cutting-edge gene-editing technologies and clinical trial advancements. From a technical analysis standpoint, BLUE is encountering significant support and resistance levels that can guide near-term price action. Support Levels 1. The recent all-time low around $0.45, reached in early October 2024, acts as a critical support level. This price point reflects a historical low, and should the stock test this level again, it will be important to monitor whether buyers step in to prevent further declines. 2. The next support level appears near $0.50, which is slightly above the all-time low, representing a psychological level where buyers might find value. Resistance Levels: 1. A significant resistance level is around $0.70, where the stock has faced selling pressure. This level is important because breaking above it could indicate a shift toward a bullish trend, with more upward momentum. 2. Further resistance is expected near $1.00, which would be a key psychological barrier. Overcoming this could signal the potential for more gains if accompanied by positive news or developments. In the short term, BLUE's technical chart shows the stock is trading in a neutral range with significant overhead resistance, and buyers may defend the support at around $0.45. I bought this stock this morning at around $.54 with a short-term hold plan. It is trading above its 50-day and 200-day simple moving averages, typically seen as a bullish indicator. However, the 50-day moving average is below the 200-day average, giving a strong bearish signal. This suggests potential downward pressure in the near term if this trend continues, hence the short-term hold plan.
0
1
New comment Oct 8
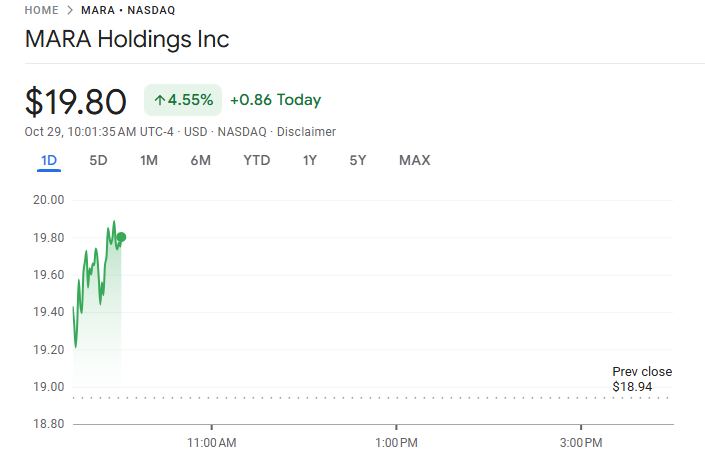
MARA • NASDAQ MARA Holdings Inc
This is not investment advice; it’s a trade idea for educational purposes. All trades are inherently risky and may result in a loss. Please do your own research. -------------------------------- MARA • NASDAQ MARA Holdings Inc Key Technical Indicators Currently trading at: $19.80 (above recent resistance) 20-Day Moving Average: $16.46, indicating short-term price trends. 50-Day Moving Average: $16.52, showing that the stock has been consolidating within this range recently Support Level: $17.45. Resistance Level: $18.99 Beta and Volatility MARA has a high Beta of 5.51, suggesting it is significantly more volatile compared to the overall market. This high volatility is typical for stocks within the cryptocurrency mining sector due to fluctuating crypto prices. Summary: MARA has experienced substantial price movements recently, and its average trading volume is around 40 million shares over the past 20 days, indicating strong market interest. The stock price currently trades close to its resistance level, suggesting potential breakout opportunities if it gains momentum. MARA Holdings, Inc. (formerly known as Marathon Digital Holdings, Inc.) operates as a digital asset technology company focusing primarily on mining digital assets, particularly Bitcoin. The company plays a significant role in securing the Bitcoin blockchain ledger, which involves validating transactions and adding them to the public ledger, ensuring the integrity and security of the cryptocurrency ecosystem. MARA leverages innovative technologies to convert underutilized, clean, and stranded energy sources into economic value through its digital asset compute operations. Essentially, they aim to use renewable or otherwise wasted energy to power their cryptocurrency mining activities, thereby supporting the broader push towards energy transformation. Founded in 2010 and headquartered in Fort Lauderdale, Florida, MARA Holdings has positioned itself as a leading player in the digital asset space, with a particular emphasis on increasing its operational hash rate to boost Bitcoin production. As of the latest data, the company has 109 employees and substantial digital asset holdings, making it one of the more prominent publicly listed Bitcoin miners.
1
1
New comment Oct 30

FTEL • NASDAQ Fitell Corp
This is not investment advice; it’s a trade idea for educational purposes. All trades are inherently risky and may result in a loss. Please do your own research. -------------------------------- FTEL • NASDAQ Fitell Corp - Current Price: $28.36 - 20-Day Moving Average (MA): $54.05 (based on prior historical trends) - 50-Day Moving Average (MA): Insufficient data to calculate due to limited historical data points. - Support Level: $26.59 - Resistance Level: $30.13 Key Observations: - The stock's current price is positioned near the recalculated support level of $26.59, suggesting that it is relatively close to a potential zone of buying interest. - The resistance level at $30.13 could act as a cap to upward movement unless there’s a strong breakout. - The moving averages indicate past higher trading levels, suggesting that the current drop in price may either signal a buying opportunity or require a cautious approach if the downtrend continues.
1
0
1-20 of 20

skool.com/daily-stock-tip-6173
THIS IS NOT INVESTMENT ADVICE. This group will have a daily stock tip posted. This is for purely entertainment and educational purposes only
powered by

