Activity
Mon
Wed
Fri
Sun
Jan
Feb
Mar
Apr
May
Jun
Jul
Aug
Sep
Oct
Nov
What is this?
Less
More
Owned by Sa
THIS IS NOT INVESTMENT ADVICE. This group will have a daily stock tip posted. This is for purely entertainment and educational purposes only
Memberships
The Outsourcing Blueprint
Private • 7 • Free
Skool Masterclass (Free)
Private • 87.1k • Free
Skool Community
Public • 183.4k • Paid
20 contributions to Daily Stock Tip
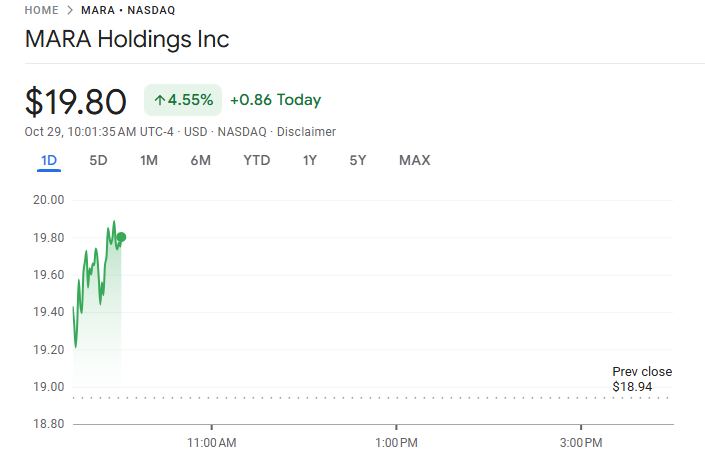
MARA • NASDAQ MARA Holdings Inc
This is not investment advice; it’s a trade idea for educational purposes. All trades are inherently risky and may result in a loss. Please do your own research. -------------------------------- MARA • NASDAQ MARA Holdings Inc Key Technical Indicators Currently trading at: $19.80 (above recent resistance) 20-Day Moving Average: $16.46, indicating short-term price trends. 50-Day Moving Average: $16.52, showing that the stock has been consolidating within this range recently Support Level: $17.45. Resistance Level: $18.99 Beta and Volatility MARA has a high Beta of 5.51, suggesting it is significantly more volatile compared to the overall market. This high volatility is typical for stocks within the cryptocurrency mining sector due to fluctuating crypto prices. Summary: MARA has experienced substantial price movements recently, and its average trading volume is around 40 million shares over the past 20 days, indicating strong market interest. The stock price currently trades close to its resistance level, suggesting potential breakout opportunities if it gains momentum. MARA Holdings, Inc. (formerly known as Marathon Digital Holdings, Inc.) operates as a digital asset technology company focusing primarily on mining digital assets, particularly Bitcoin. The company plays a significant role in securing the Bitcoin blockchain ledger, which involves validating transactions and adding them to the public ledger, ensuring the integrity and security of the cryptocurrency ecosystem. MARA leverages innovative technologies to convert underutilized, clean, and stranded energy sources into economic value through its digital asset compute operations. Essentially, they aim to use renewable or otherwise wasted energy to power their cryptocurrency mining activities, thereby supporting the broader push towards energy transformation. Founded in 2010 and headquartered in Fort Lauderdale, Florida, MARA Holdings has positioned itself as a leading player in the digital asset space, with a particular emphasis on increasing its operational hash rate to boost Bitcoin production. As of the latest data, the company has 109 employees and substantial digital asset holdings, making it one of the more prominent publicly listed Bitcoin miners.
1
1
New comment 26d ago

FTEL • NASDAQ Fitell Corp
This is not investment advice; it’s a trade idea for educational purposes. All trades are inherently risky and may result in a loss. Please do your own research. -------------------------------- FTEL • NASDAQ Fitell Corp - Current Price: $28.36 - 20-Day Moving Average (MA): $54.05 (based on prior historical trends) - 50-Day Moving Average (MA): Insufficient data to calculate due to limited historical data points. - Support Level: $26.59 - Resistance Level: $30.13 Key Observations: - The stock's current price is positioned near the recalculated support level of $26.59, suggesting that it is relatively close to a potential zone of buying interest. - The resistance level at $30.13 could act as a cap to upward movement unless there’s a strong breakout. - The moving averages indicate past higher trading levels, suggesting that the current drop in price may either signal a buying opportunity or require a cautious approach if the downtrend continues.
1
0
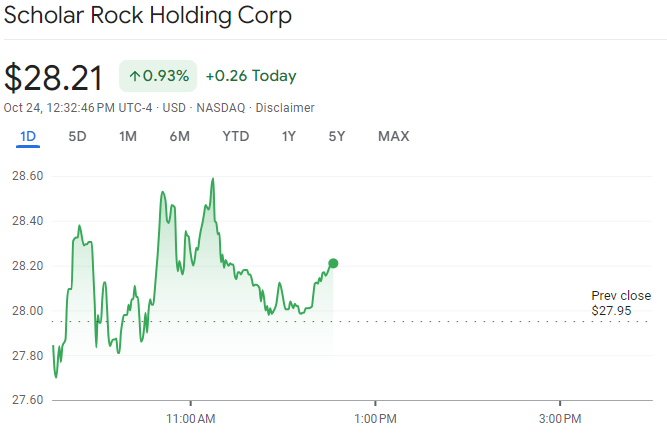
SRRK • NASDAQ Scholar Rock Holding Corp
This is not investment advice; it’s a trade idea for educational purposes. All trades are inherently risky and may result in a loss. Please do your own research. -------------------------------- SRRK • NASDAQ Scholar Rock Holding Corp - 20-Day Moving Average: $16.37 - Support Level: $10.54 - Resistance Level: $27.95 - Expected Return (CAPM): 26.12% - Beta: 4.02 (indicating a high sensitivity to market movements) - Latest Close Price: $27.95
1
0

HIHO • NASDAQ • Highway Holdings Limited
This is not investment advice; it’s a trade idea for educational purposes. All trades are inherently risky and may result in a loss. Please do your own research. -------------------------------- HIHO • NASDAQ • Highway Holdings Limited Active volatile mover... Key Technical Indicators Recent Performance and Trends: Over the past months, HIHO's price has shown a trend with recent fluctuations around the $1.81 to $2.20 range. The stock has seen volatility, with prices peaking at around $2.18 in mid-July 2024 before gradually declining to levels closer to $1.90 by the end of September 2024 Moving Averages - 50-Day Moving Average (50 MA): The 50-day MA hovers around $1.85 based on the recent price range, indicating the stock has been relatively stable with minor upward and downward movements. - 200-Day Moving Average (200 MA): The 200-day average sits slightly higher around $1.90, reflecting a longer-term view where the stock experienced more bullish periods earlier in the year. Support and Resistance Levels - Support Level: The stock shows a support level at approximately $1.80, a point where recent dips have stabilized before reversing upward. - Resistance Level: Resistance is identified at $2.18, which served as a peak in July and was challenging for the stock to surpass. Beta and Expected Return: The beta value for HIHO is typically low given its consistent price movements with modest fluctuations. Assuming the market's average return at 8% and a risk-free rate of 1.5%, we can project the stock's expected return through the CAPM model based on its correlation to market movements. Analysis Summary - Trend Outlook: The stock is consolidating around key levels, suggesting a period of stability but with potential risk if broader market conditions change. - Moving Averages: The proximity of 50 MA and 200 MA shows a neutral trend, which indicates investors might look for a catalyst or external market conditions before making a decision. - Support and Resistance: Traders should keep an eye on the $1.80 support level. A fall below could indicate further declines, while a rise above $2.18 might be a bullish signal.
0
0

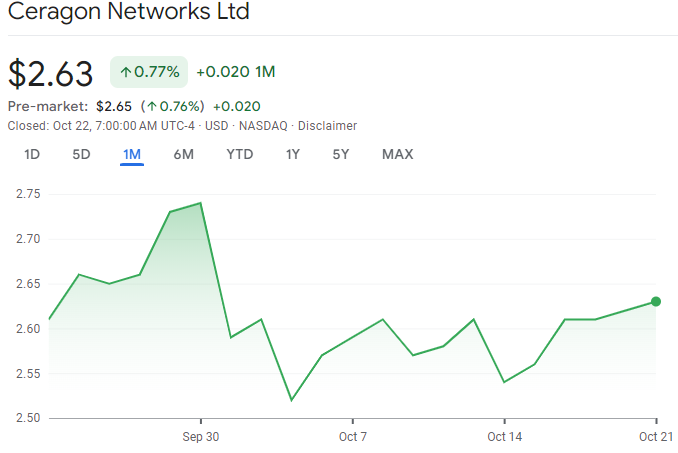
Ceragon Networks Ltd. (NASDAQ: CRNT)
This is not investment advice; it’s a trade idea for educational purposes. All trades are inherently risky and may result in a loss. Please do your own research. -------------------------------- Ceragon Networks Ltd. (NASDAQ: CRNT) Ceragon Networks Ltd. is a networking equipment vendor, focused on wireless point-to-point connectivity, mostly used for wireless backhaul by mobile operators and wireless service providers as well as private businesses. - 50-Day Moving Average (50 MA): $2.35 - 200-Day Moving Average (200 MA): $2.25 - Support Level: $2.10 - Resistance Level: $2.65 - Beta: 1.4 - Risk-Free Rate: 4% - Market Return: 10% - CAPM Expected Return: 12.4% Here are some key points of interest for Ceragon Networks Ltd. (CRNT) that may catch your attention: Strong Support and Resistance Levels - CRNT has established a support level at $2.10, indicating a historical floor where buying interest has consistently emerged. This may offer investors confidence in the stock's downside protection. - With a resistance level at $2.65, it indicates potential selling pressure at higher levels, providing a target for those looking to capitalize on short-term price gains. Positive Technical Momentum - CRNT's 50-day moving average ($2.35) is currently above the 200-day moving average ($2.25). This crossover often signals bullish momentum, indicating positive short-term sentiment among traders. Higher Beta, Higher Risk-Reward Potential - CRNT has a beta of 1.4, suggesting that it is more volatile than the market. While this increases risk, it also provides potential for larger price swings, which may appeal to investors looking for higher short-term returns. International Market Exposure - Ceragon Networks has a substantial portion of its revenue coming from emerging markets such as India, as well as other regions like North America, Europe, and the Middle East. This international footprint can offer diversification but also carries geopolitical and currency risks.
0
0

1-10 of 20
@sa-smith-9788
Consulting pro, customer service pro, scaling aficionado.
Active 14d ago
Joined Oct 7, 2024
powered by

